Gold is the premier store of value over the course of history retaining its purchasing power for life’s necessities.
Gold and other precious metals provide economic security. For thousands of years, people the world over have sought the safety and stability of these natural precious elements. Indeed, no currency or security has outlasted precious metals as a store of value over time.
Accumulate Gold and Silver
Purchasing power represents the amount of goods and services that can be bought with money. Intelligent investors should aim to preserve their purchasing power by ensuring that money earned in the present remains valuable in the future when it needs to be spent.
Historically, buying gold and silver has been an excellent means of preserving purchasing power over long periods of time. A comparison of value between these metals, a barrel of oil, the average price of a home, or the price of beef shows that when measured in precious metals, the price of basic human necessities (energy, food, shelter) remains unchanged. The further we go back in history, the more obvious the trend becomes.
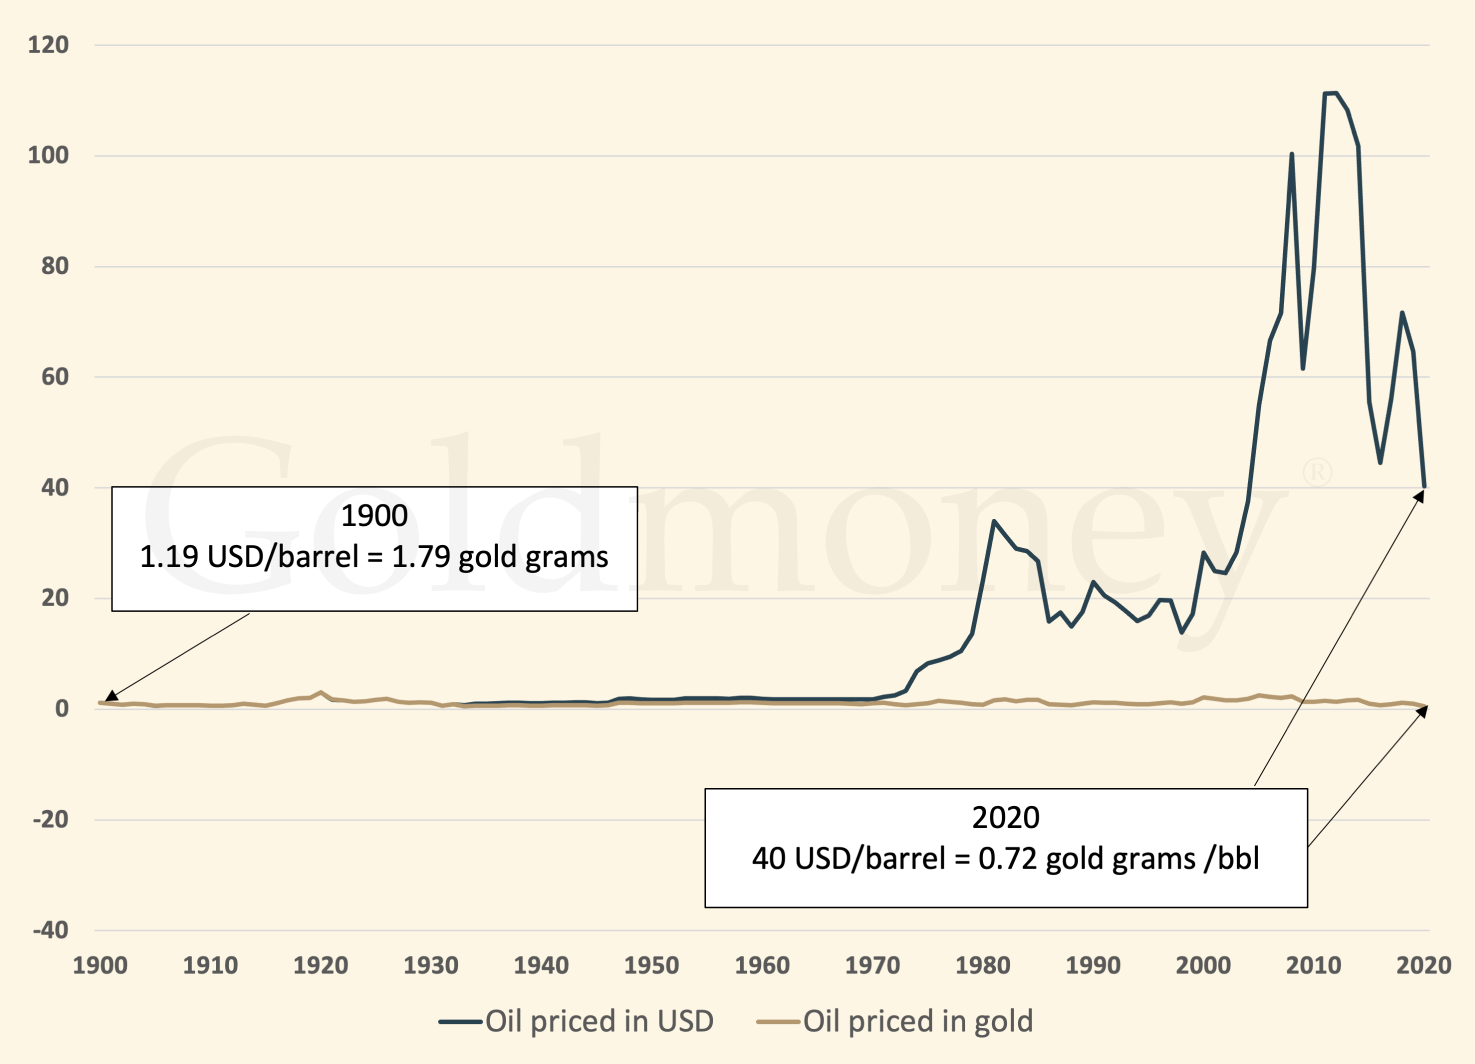
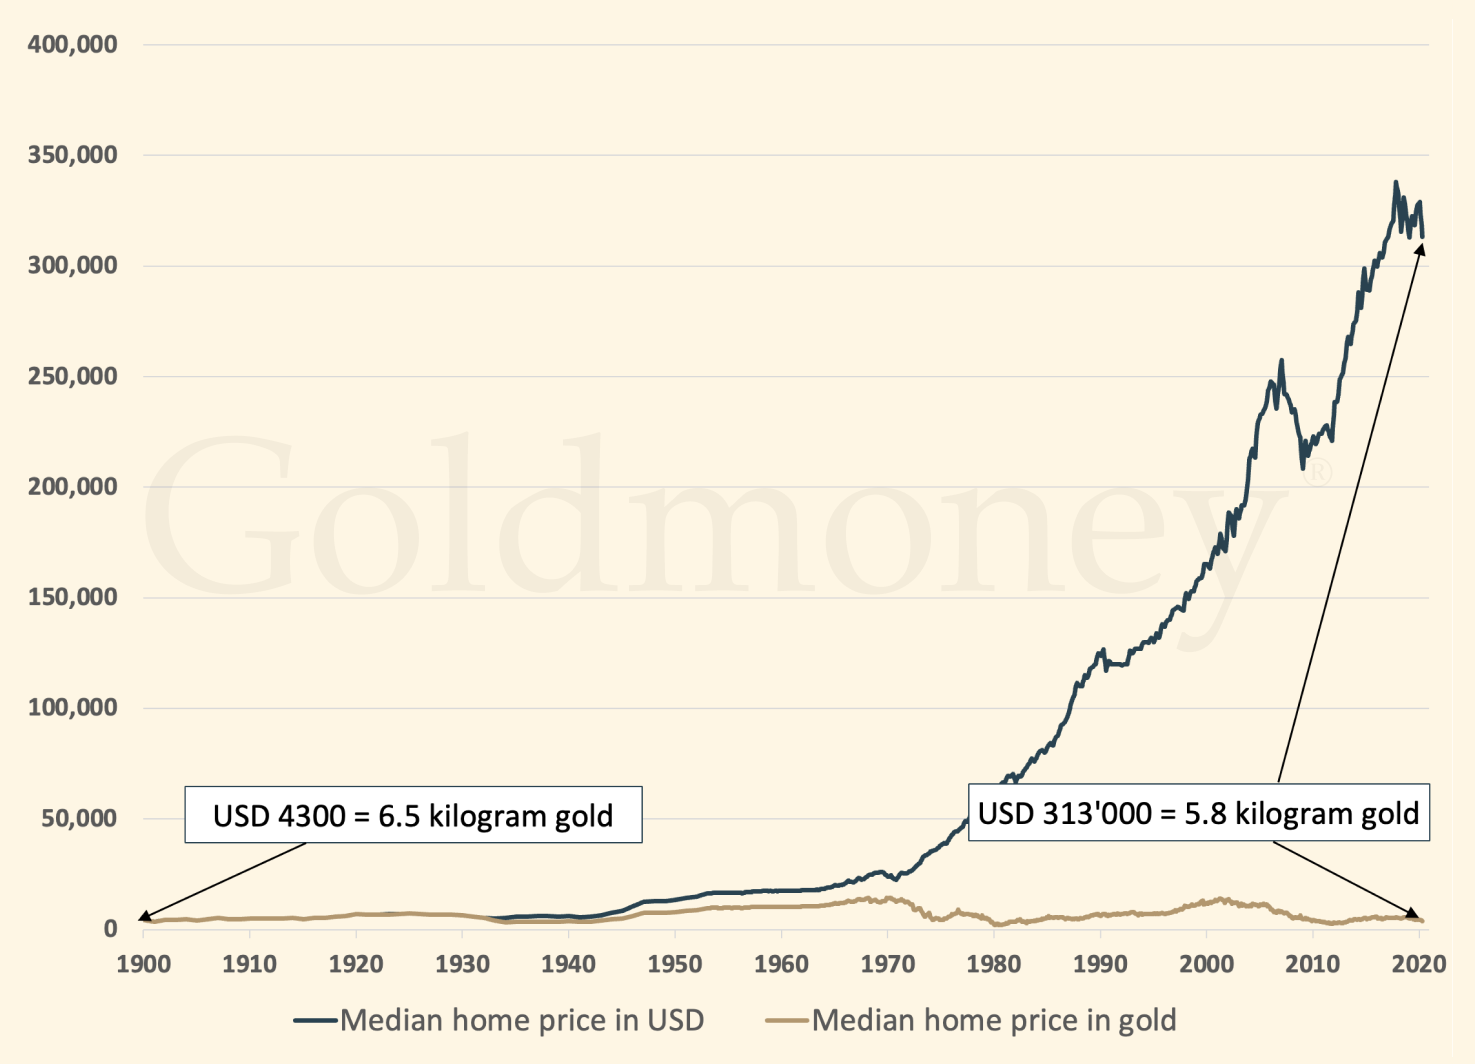
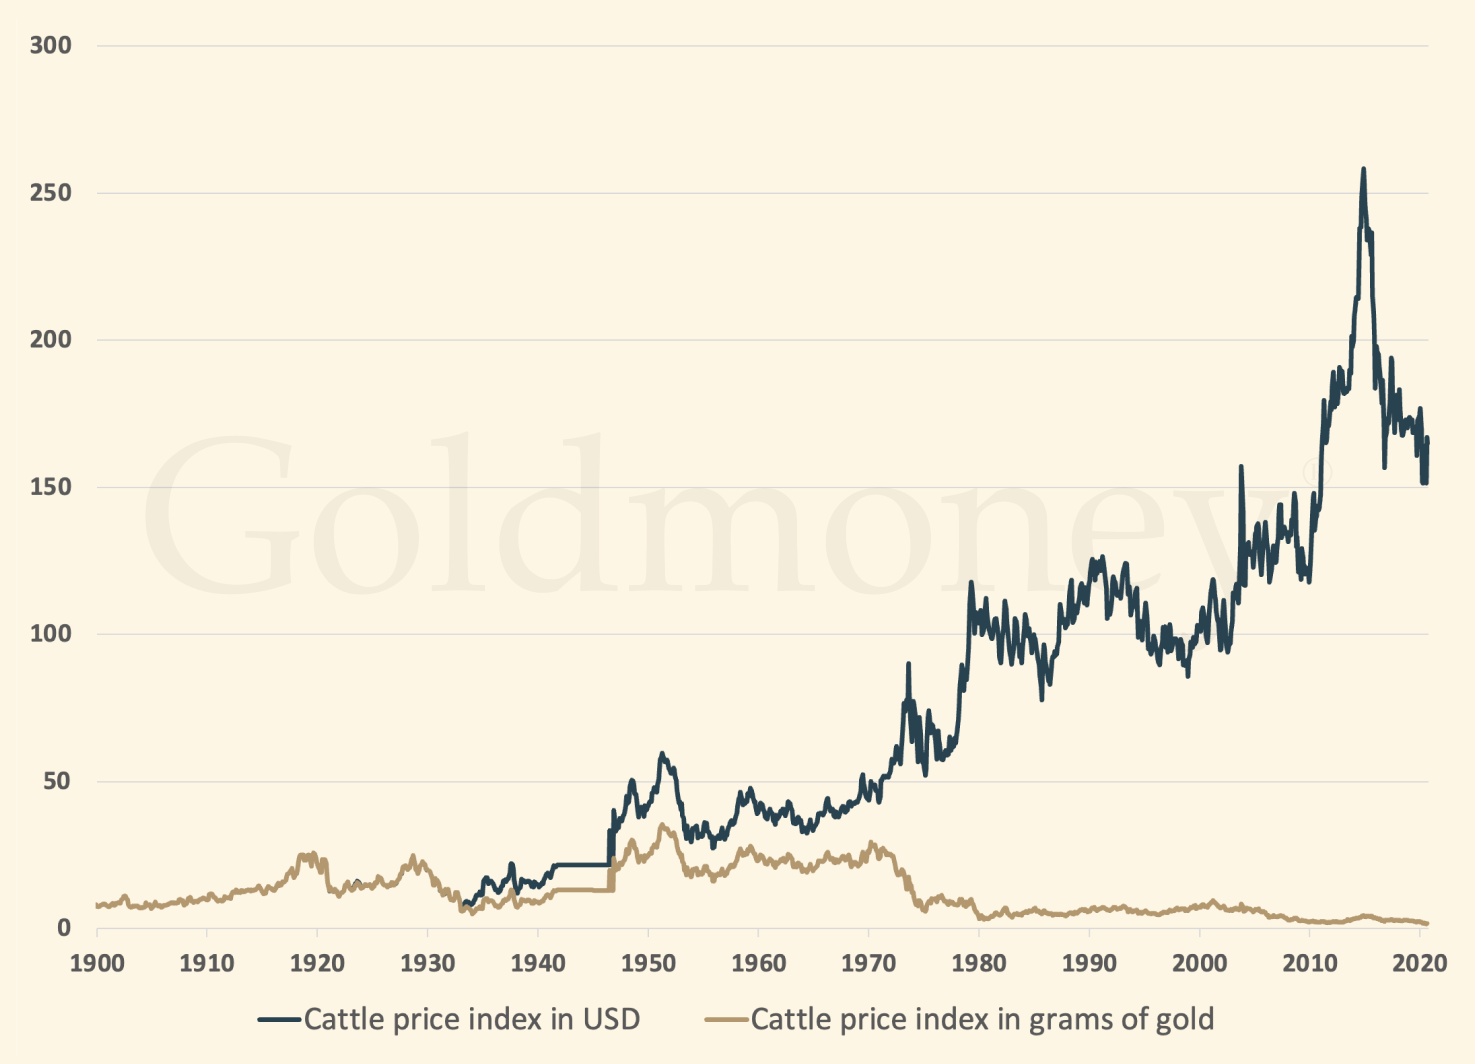
As these graphs indicate, the same weight of gold and silver buys an equivalent unit of oil, housing, and food over a one-hundred-year period. This effortless preservation of purchasing power on the part of precious metals stands in stark contrast to the performance of fiat currencies issued by governments such as the US dollar.
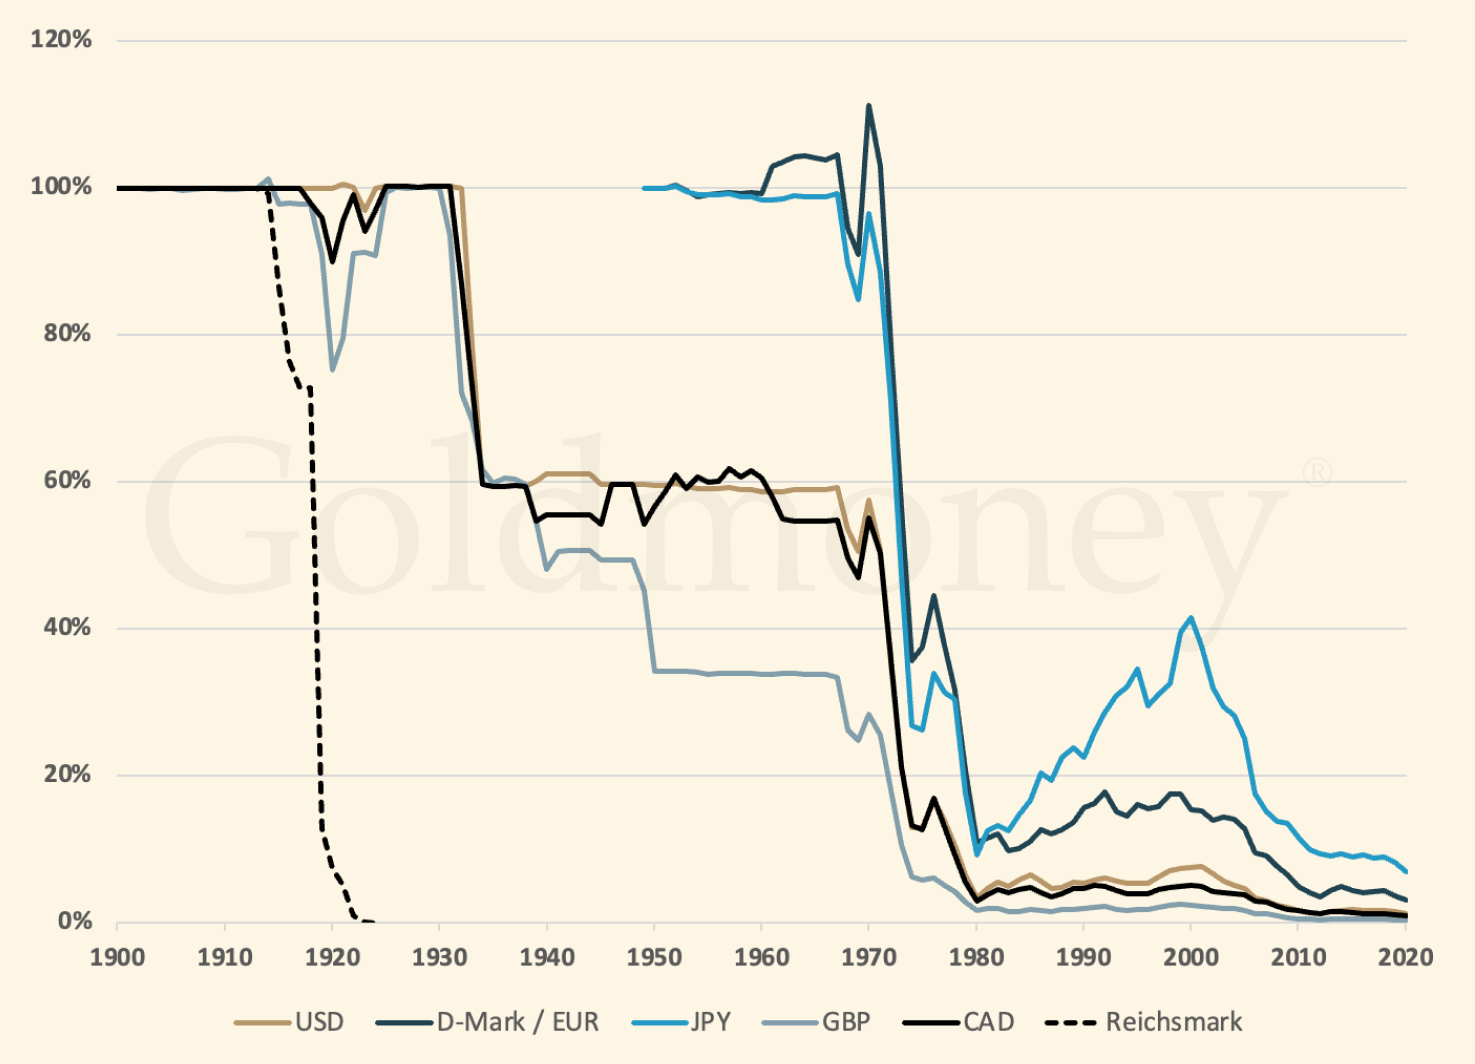
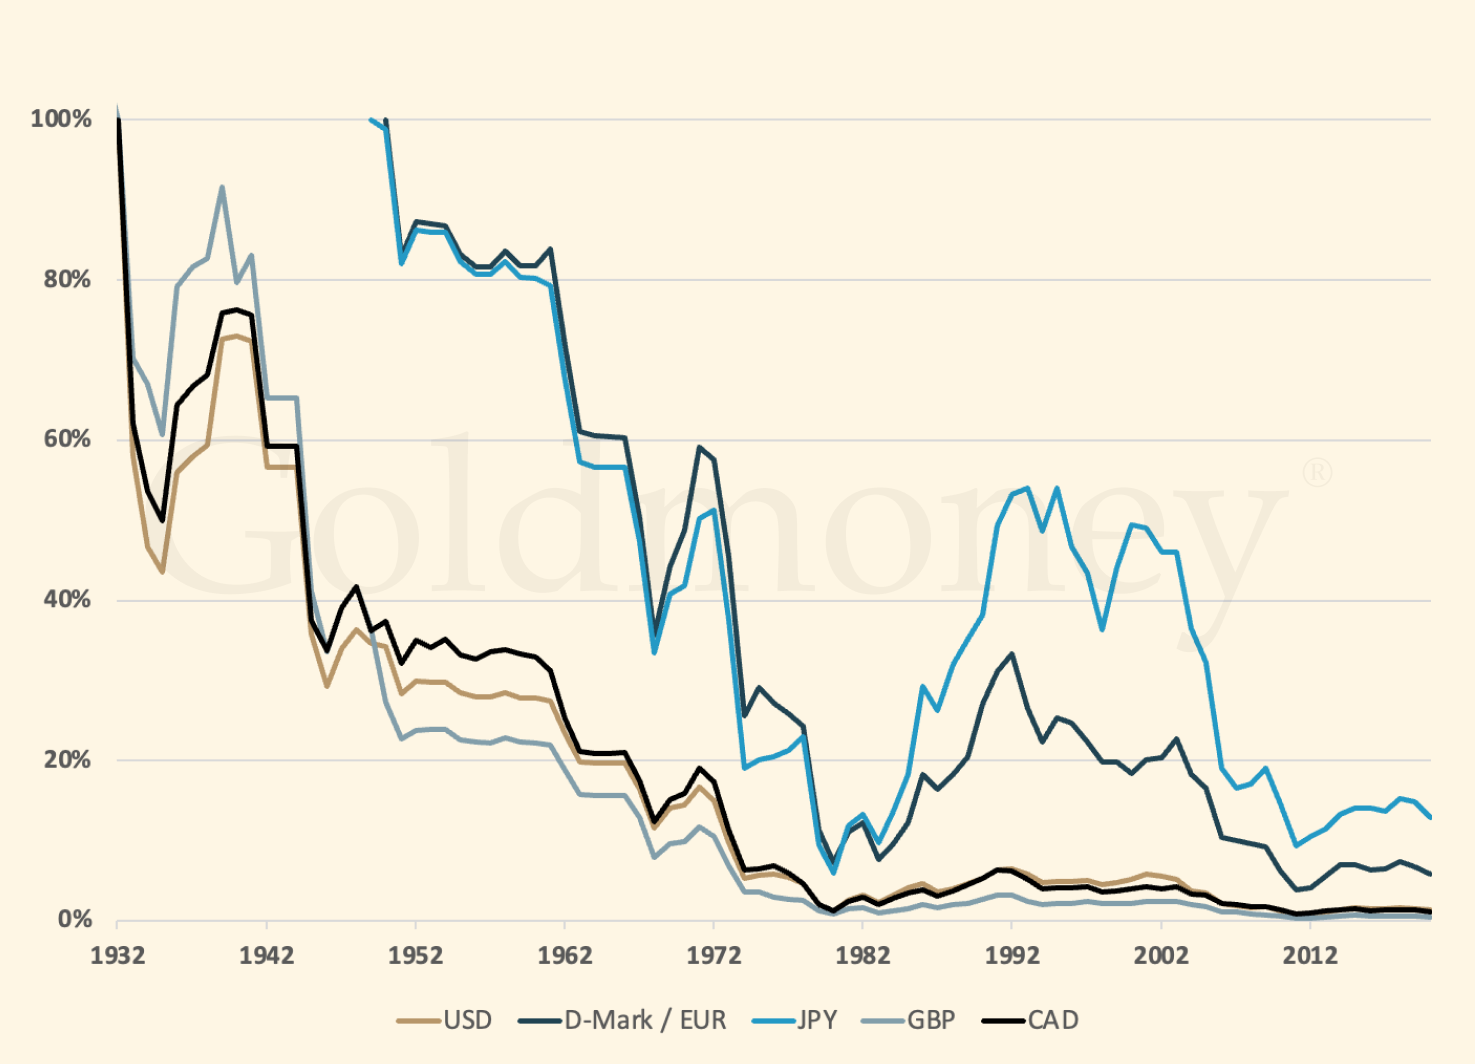
The above graph shows the value of a basket of fiat currencies in relation to gold and silver over a one-hundred-year period. The issue facing investors is that fiat currencies erode in value over time as governments systematically debase their national currencies, and thus their citizens’ purchasing power, by funding budget deficits, trade deficits, bailouts, and geopolitical war. By consequence, Central banks have lost their independence and have become political instruments that seek increasing control over the economy under a misguided theory that inflation stimulates economic growth. As things presently stand, virtually every country in the world is pursuing some version of this strategy when it comes to their monetary system.
Whether this approach is the right one on a national level is not of concern to the average individual who merely seeks to maintain their purchasing power and preserve their hard-earned wealth for the benefit of their family.
History has shown that given enough time, all fiat currencies lose purchasing power relative to gold and silver. Precious metals exhibit unique natural attributes such as scarcity, durability, conductivity. These attributes make precious metals desirable for economic activity while also fixing their supply. Most importantly, precious metals correspond to the laws of nature. Fiat currencies, on the other hand, can be created out of thin air and are only accountable to the whims of governments and central banks.
It is for this reason that intelligent investors have sought to own precious metals and why these natural elements have been treated as money for over 5,000 years by virtually every human civilization.
The US Dollar and Eight Other Fiat Currencies Versus Gold
The table below displays the annual change in gold’s rate of exchange against nine fiat currencies over the past two decades.
Gold % Annual Change
| USD | AUD | CAD | CNY | EUR | INR | JPY | CHF | GBP | |
|---|---|---|---|---|---|---|---|---|---|
| 2005 | 17.9% | 25.6% | 14.0% | 15.0% | 34.9% | 22.1% | 35.3% | 35.9% | 31.3% |
| 2006 | 23.2% | 14.5% | 23.5% | 19.2% | 10.6% | 21.0% | 24.5% | 14.4% | 8.3% |
| 2007 | 30.9% | 18.0% | 12.1% | 22.4% | 18.4% | 16.6% | 22.9% | 21.7% | 29.2% |
| 2008 | 5.8% | 31.8% | 29.2% | -1.2% | 10.5% | 30.7% | -14.1% | 0.1% | 43.9% |
| 2009 | 24.4% | -2.6% | 7.3% | 24.4% | 21.3% | 18.9% | 27.5% | 19.9% | 12.2% |
| 2010 | 29.6% | 13.7% | 22.9% | 25.3% | 38.6% | 24.5% | 13.1% | 17.2% | 34.2% |
| 2011 | 10.1% | 10.4% | 12.7% | 5.1% | 13.7% | 30.8% | 4.4% | 10.6% | 10.6% |
| 2012 | 7.1% | 5.2% | 4.0% | 5.9% | 5.2% | 10.5% | 20.7% | 4.3% | 2.4% |
| 2013 | -28.3% | -16.4% | -23.2% | -30.3% | -31.1% | -19.1% | -12.9% | -30.0% | -29.6% |
| 2014 | -1.4% | 7.5% | 7.8% | 1.0% | 12.0% | 0.8% | 12.0% | 9.8% | 4.8% |
| 2015 | -10.4% | 0.5% | 6.7% | -6.3% | -0.2% | -6.2% | -10.0% | -9.7% | -5.3% |
| 2016 | 8.1% | 9.3% | 5.0% | 15.7% | 11.7% | 11.0% | 5.2% | 9.9% | 29.1% |
| 2017 | 13.5% | 4.8% | 6.2% | 6.4% | -0.5% | 6.6% | 9.4% | 8.6% | 3.7% |
| 2018 | -1.6% | 9.1% | 6.8% | 4.0% | 3.1% | 7.4% | -4.2% | -0.8% | 4.3% |
| 2019 | 18.3% | 18.8% | 12.7% | 19.8% | 21.0% | 21.0% | 17.3% | 16.6% | 13.8% |
| 2020 | 25.1% | 14.2% | 22.6% | 17.3% | 14.8% | 28.3% | 19.0% | 14.4% | 21.3% |
| 2021 | -3.6% | 2.1% | -4.4% | -6.2% | 3.5% | -1.7% | 7.4% | -0.7% | -2.7% |
| 2022 | -0.3% | 6.3% | 6.9% | 8.2% | 5.9% | 10.7% | 13.6% | 1.1% | 11.7% |
| 2023 | 13.1% | 13.1% | 10.5% | 16.4% | 9.7% | 13.8% | 21.7% | 2.9% | 7.3% |
| 2024 | 27.2% | 40.0% | 38.2% | 30.8% | 35.6% | 30.9% | 41.8% | 37.2% | 29.4% |
| 2025 | 64.6% | 52.6% | 57.0% | 57.6% | 45.1% | 72.8% | 64.1% | 43.8% | 52.9% |
| Avg. 10 Years | 16.5% | 17.0% | 16.2% | 17.0% | 15.0% | 20.1% | 19.5% | 13.3% | 17.1% |
| 10 Years | 307.1% | 344.5% | 303.8% | 338.1% | 276.4% | 452.5% | 430.5% | 221.9% | 345.2% |
The US Dollar and Eight Other Fiat Currencies Versus Silver
The table below displays the annual change in silver’s rate of exchange against nine fiat currencies over the past two decades.
Silver % Annual Change
| USD | AUD | CAD | CNY | EUR | INR | JPY | CHF | GBP | |
|---|---|---|---|---|---|---|---|---|---|
| 2005 | 29.2% | 37.6% | 24.9% | 26.0% | 47.8% | 33.8% | 48.2% | 48.9% | 43.8% |
| 2006 | 46.4% | 36.1% | 46.9% | 41.7% | 31.4% | 43.9% | 48.1% | 36.0% | 28.8% |
| 2007 | 14.6% | 3.3% | -1.8% | 7.2% | 3.7% | 2.1% | 7.6% | 6.5% | 13.1% |
| 2008 | -22.9% | -4.0% | -5.9% | -28.0% | -19.5% | -4.8% | -37.4% | -27.1% | 4.8% |
| 2009 | 48.0% | 15.9% | 27.7% | 48.1% | 44.4% | 41.5% | 51.7% | 42.7% | 33.6% |
| 2010 | 83.2% | 60.7% | 73.8% | 77.1% | 96.0% | 76.0% | 59.8% | 65.7% | 89.7% |
| 2011 | -9.9% | -9.7% | -7.8% | -14.0% | -7.0% | 7.0% | -14.6% | -9.6% | -9.5% |
| 2012 | 9.0% | 7.1% | 5.9% | 7.8% | 7.1% | 12.5% | 22.9% | 6.3% | 4.2% |
| 2013 | -35.8% | -25.2% | -31.3% | -37.6% | -38.4% | -27.6% | -22.1% | -37.4% | -37.0% |
| 2014 | -19.3% | -12.0% | -11.7% | -17.3% | -8.3% | -17.5% | -8.3% | -10.1% | -14.2% |
| 2015 | -11.9% | -1.1% | 4.9% | -7.8% | -1.8% | -7.7% | -11.4% | -11.2% | -6.8% |
| 2016 | 15.0% | 16.3% | 11.7% | 23.1% | 18.8% | 18.1% | 11.9% | 16.9% | 37.3% |
| 2017 | 6.3% | -1.8% | -0.5% | -0.4% | -6.8% | -0.1% | 2.4% | 1.7% | -2.9% |
| 2018 | -8.5% | 1.3% | -0.7% | -3.4% | -4.2% | -0.2% | -11.0% | -7.9% | -3.1% |
| 2019 | 15.2% | 15.7% | 9.7% | 16.6% | 17.8% | 17.9% | 14.2% | 13.6% | 10.8% |
| 2020 | 47.9% | 35.0% | 45.0% | 38.6% | 35.8% | 51.7% | 40.7% | 35.2% | 43.4% |
| 2021 | -11.7% | -6.5% | -12.4% | -14.0% | -5.1% | -10.0% | -1.6% | -9.0% | -10.8% |
| 2022 | 2.8% | 9.6% | 10.2% | 11.5% | 9.2% | 14.1% | 17.1% | 4.2% | 15.1% |
| 2023 | -0.7% | -0.7% | -2.9% | 2.3% | -3.7% | -0.1% | 6.9% | -9.6% | -5.7% |
| 2024 | 21.5% | 33.7% | 31.9% | 24.9% | 29.5% | 25.0% | 35.4% | 31.0% | 23.5% |
| 2025 | 148.0% | 129.9% | 136.6% | 137.4% | 118.6% | 160.3% | 147.2% | 116.6% | 130.3% |
| Avg. 10 Years | 23.6% | 23.2% | 22.9% | 23.7% | 21.0% | 27.7% | 26.3% | 19.3% | 23.8% |
| 10 Years | 417.5% | 465.0% | 413.3% | 457.0% | 378.5% | 602.4% | 574.4% | 309.2% | 465.9% |
The US Dollar and Eight Other Fiat Currencies Versus Platinum
The table below displays the annual change in platinum's rate of exchange against nine fiat currencies over the past two decades.
Platinum % Annual Change
| USD | AUD | CAD | CNY | EUR | INR | JPY | CHF | GBP | |
|---|---|---|---|---|---|---|---|---|---|
| 2005 | 12.7% | 20.0% | 8.9% | 9.9% | 28.9% | 16.7% | 29.2% | 29.8% | 25.4% |
| 2006 | 17.1% | 8.8% | 17.4% | 13.3% | 5.1% | 15.0% | 18.4% | 8.7% | 3.0% |
| 2007 | 34.3% | 21.0% | 15.0% | 25.6% | 21.5% | 19.6% | 26.1% | 24.8% | 32.6% |
| 2008 | -38.8% | -23.7% | -25.2% | -42.8% | -36.1% | -24.3% | -50.3% | -42.1% | -16.7% |
| 2009 | 56.5% | 22.5% | 35.1% | 56.6% | 52.7% | 49.6% | 60.4% | 50.9% | 41.3% |
| 2010 | 21.0% | 6.1% | 14.8% | 17.0% | 29.5% | 16.3% | 5.6% | 9.5% | 25.3% |
| 2011 | -21.2% | -21.0% | -19.4% | -24.8% | -18.6% | -6.4% | -25.3% | -20.9% | -20.9% |
| 2012 | 10.4% | 8.5% | 7.3% | 9.2% | 8.5% | 14.0% | 24.5% | 7.6% | 5.6% |
| 2013 | -11.0% | 3.8% | -4.7% | -13.5% | -14.5% | 0.4% | 8.1% | -13.2% | -12.6% |
| 2014 | -11.9% | -3.9% | -3.6% | -9.7% | 0.1% | -9.9% | 0.2% | -1.9% | -6.3% |
| 2015 | -26.2% | -17.2% | -12.1% | -22.8% | -17.8% | -22.7% | -25.9% | -25.6% | -22.0% |
| 2016 | 1.3% | 2.4% | -1.6% | 8.4% | 4.6% | 4.0% | -1.4% | 3.0% | 21.0% |
| 2017 | 2.8% | -5.1% | -3.9% | -3.7% | -10.0% | -3.5% | -1.0% | -1.7% | -6.1% |
| 2018 | -14.3% | -5.0% | -7.0% | -9.5% | -10.3% | -6.5% | -16.6% | -13.7% | -9.2% |
| 2019 | 21.5% | 22.0% | 15.7% | 23.0% | 24.2% | 24.3% | 20.4% | 19.8% | 16.9% |
| 2020 | 10.9% | 1.2% | 8.7% | 4.0% | 1.8% | 13.8% | 5.5% | 1.4% | 7.6% |
| 2021 | -9.6% | -4.3% | -10.3% | -12.0% | -2.9% | -7.8% | 0.7% | -6.8% | -8.7% |
| 2022 | 10.9% | 18.2% | 18.9% | 20.3% | 17.8% | 23.1% | 26.3% | 12.4% | 24.2% |
| 2023 | -7.7% | -7.7% | -9.8% | -5.0% | -10.5% | -7.1% | -0.7% | -16.0% | -12.4% |
| 2024 | -8.5% | 0.7% | -0.6% | -5.9% | -2.5% | -5.9% | 2.0% | -1.3% | -6.9% |
| 2025 | 127.0% | 110.5% | 116.6% | 117.4% | 100.1% | 138.4% | 126.3% | 98.3% | 110.9% |
| Avg. 10 Years | 13.4% | 13.3% | 12.7% | 13.7% | 11.3% | 17.3% | 16.1% | 9.5% | 13.7% |
| 10 Years | 131.1% | 152.3% | 129.2% | 148.8% | 113.7% | 213.7% | 201.2% | 82.8% | 152.7% |
The US Dollar and Eight Other Fiat Currencies Versus Palladium
The table below displays the annual change in palladium's rate of exchange against nine fiat currencies over the past two decades.
Palladium % Annual Change
| USD | AUD | CAD | CNY | EUR | INR | JPY | CHF | GBP | |
|---|---|---|---|---|---|---|---|---|---|
| 2005 | 36.5% | 45.3% | 31.9% | 33.1% | 56.1% | 41.3% | 56.5% | 57.3% | 51.9% |
| 2006 | 31.2% | 22.0% | 31.7% | 27.0% | 17.8% | 29.0% | 32.7% | 21.9% | 15.4% |
| 2007 | 10.3% | -0.6% | -5.5% | 3.1% | -0.2% | -1.8% | 3.6% | 2.5% | 8.9% |
| 2008 | -49.3% | -36.8% | -38.0% | -52.6% | -47.0% | -37.3% | -58.8% | -52.0% | -31.0% |
| 2009 | 118.1% | 70.7% | 88.2% | 118.2% | 112.7% | 108.4% | 123.5% | 110.2% | 96.8% |
| 2010 | 96.7% | 72.5% | 86.6% | 90.1% | 110.4% | 89.0% | 71.6% | 77.9% | 103.7% |
| 2011 | -18.5% | -18.3% | -16.6% | -22.2% | -15.9% | -3.2% | -22.8% | -18.2% | -18.2% |
| 2012 | 7.7% | 5.8% | 4.6% | 6.6% | 5.8% | 11.2% | 21.5% | 5.0% | 3.0% |
| 2013 | 1.7% | 18.6% | 8.9% | -1.1% | -2.3% | 14.8% | 23.5% | -0.8% | -0.1% |
| 2014 | 11.3% | 21.4% | 21.8% | 14.1% | 26.5% | 13.8% | 26.6% | 24.0% | 18.3% |
| 2015 | -29.4% | -20.8% | -16.0% | -26.1% | -21.4% | -26.1% | -29.1% | -28.8% | -25.4% |
| 2016 | 21.0% | 22.3% | 17.5% | 29.5% | 24.9% | 24.2% | 17.7% | 23.0% | 44.4% |
| 2017 | 56.2% | 44.2% | 46.1% | 46.3% | 36.8% | 46.7% | 50.4% | 49.4% | 42.6% |
| 2018 | 18.6% | 31.4% | 28.7% | 25.3% | 24.2% | 29.4% | 15.4% | 19.5% | 25.7% |
| 2019 | 54.2% | 54.8% | 46.9% | 56.1% | 57.7% | 57.8% | 52.8% | 52.0% | 48.3% |
| 2020 | 25.9% | 14.9% | 23.4% | 18.0% | 15.5% | 29.1% | 19.7% | 15.1% | 22.1% |
| 2021 | -22.2% | -17.6% | -22.8% | -24.3% | -16.4% | -20.7% | -13.3% | -19.8% | -21.4% |
| 2022 | -5.9% | 0.3% | 0.9% | 2.1% | 0.0% | 4.5% | 7.2% | -4.6% | 5.4% |
| 2023 | -38.6% | -38.6% | -40.0% | -36.8% | -40.5% | -38.3% | -34.0% | -44.1% | -41.7% |
| 2024 | -17.1% | -8.7% | -9.9% | -14.7% | -11.6% | -14.7% | -7.5% | -10.5% | -15.6% |
| 2025 | 77.5% | 64.6% | 69.4% | 70.0% | 56.5% | 86.4% | 77.0% | 55.1% | 64.9% |
| Avg. 10 Years | 17.0% | 16.8% | 16.0% | 17.1% | 14.7% | 20.4% | 18.5% | 13.5% | 17.5% |
| 10 Years | 187.8% | 214.2% | 185.4% | 209.7% | 166.1% | 290.6% | 275.0% | 127.6% | 214.7% |
How Much Should I Buy?
Choosing how much gold and silver to buy should be a personal decision. Research has shown that wealthy individuals maintain around 10% of their wealth in precious metals.
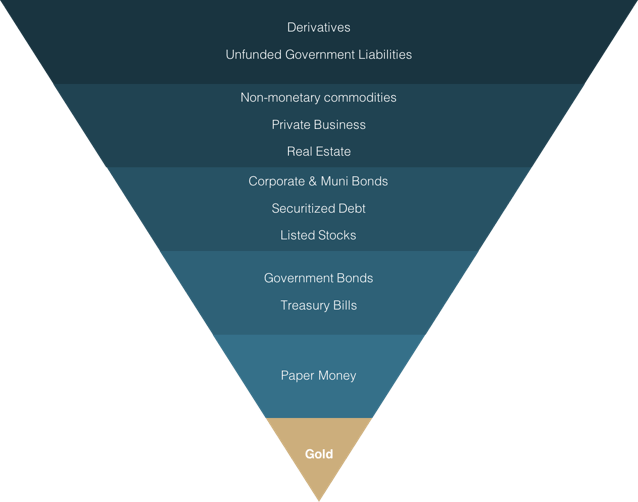
The first proponent of the “10% rule” was former Federal Reserve Governor and Harvard educated economist John Exter via his eponymous “Exter’s Pyramid” which illustrates the inherent risks within each type of asset class. At the bottom of Exter’s pyramid is gold which forms the foundation. At Goldmoney, we agree with Exter’s core principal and believe that a 10-20% allocation to gold is wise. For citizens of nations with very high inflation and weaker government accountability, the allocation should be even higher.
Additional Reading
There is a rich intellectual tradition focused on the study of precious metals. This tradition extends across economics, philosophy, and natural sciences. At Goldmoney, we hope to empower our clients with this wisdom by providing access to a repository of books, articles, and papers on our research platform.
Below is a sample of some of our proprietary research as a starting point for new clients.
- A Cure for the Money Virus by Roy Sebag – April 3, 2020
- Milkshakes, Sugar Highs, and Gold by Roy Sebag – March 12, 2020
- The Golden Road Remains Constant by Roy Sebag - November 30, 2020
- Gold Price Framework Vol 2: The energy side of the equation Part II by Stefan Wieler - May 28, 2018
- SavingsTech Back to the Future Edition by Goldmoney Staff - October 20, 2015
- Money and the theory of exchange by Alasdair Macleod - October 17, 2019
- Anatomy of a fiat currency collapse by Alasdair Macleod - April 23, 2020
- Fiat's failings, gold and blockchains by Alasdair Macleod - December 05, 2019